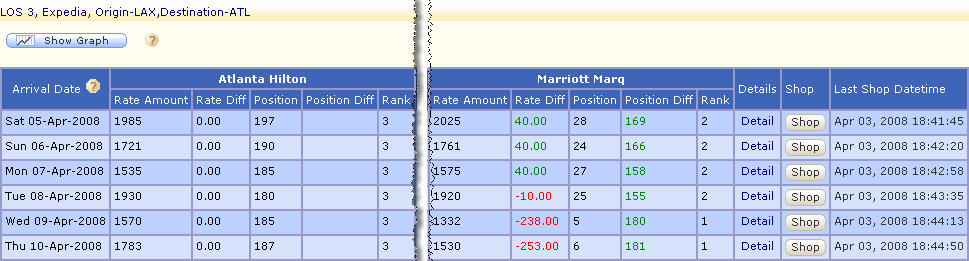
Package Shop Compset Report
The Package Shop Compset report displays a comparison of the display position and the rates retrieved for the selected compset while shopping for package rates. Display position is the position in which the rate of a selected property is displayed on a search result page.
The arrival dates are displayed in the first column of the rate report. A comparison of rates for each property is displayed in the following columns. The rates for each length of stay and data source are displayed in separate rate grids.
![]()
The header of the rate grid displays the length of stay, data source, and the origin and the destination codes that was used while shopping the rates.
The position comparison is displayed in separate columns for each property. The Rate Amount column displays the rate that was displayed on the search result page. The Rate Diff column displays the rate difference between a property rate as compared to the selected property rate. The Position column displays the position in which the rate was displayed on the search result page. The Position Diff column displays the difference in position when a property is compared to the selected property. The Rank column displays the position of a property within the selected compset.
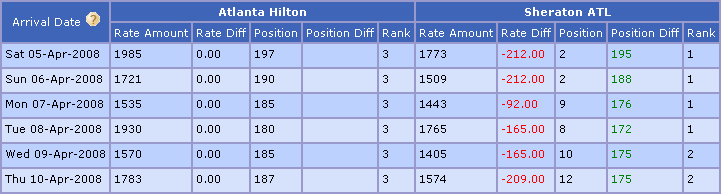
In the above rate report, Atlanta Hilton is the selected property and hence the display position and the rates of Atlanta Hilton are used for comparison. The Rate Amount column for Atlanta Hilton and Sheraton ATL displays the rates that were displayed on the search result page.
The Rate Diff column displays the difference between the property rates as compared to the rates of the selected property. Since the rates of Atlanta Hilton are compared with its own rate the Rate Diff for Atlanta Hilton in all the rows is zero. For Sheraton ATL, the rate difference as compared with Atlanta Hilton for 05-Apr-2008 is -212.00. This indicates that the rate of Sheraton ATL was 212.00 dollars less than Atlanta Hilton. If a rate is lower than the selected property rate then the Rate Diff is displayed in red. If a rate is higher than the selected property rate then the Rate Diff is displayed in green.
The Position column displays the position in which the rates were displayed on the search result pages. In the above rate report, Atlanta Hilton was displayed in the 197th position and Sheraton ATL was displayed in the second position for the arrival date 05-Apr-2008.
The Position Diff column displays the difference in the placement of a property as compared to the selected property placement on the search result pages. The Position Diff column for Atlanta Hilton is blank since its placement position is compared with its own position. The Position Diff for Sheraton ATL for the arrival date 05-Apr-2008 is 195, since Sheraton ATL was in position 2 and Atlanta Hilton was in position 197. If a rate is placed above the selected property rate on the search result page, the Position Diff is displayed in red. If a rate is placed below the selected property rate on the search result page the Position Diff is displayed in green.
The Rank column displays the price position of the property within the selected compset. In the above rate report, Sheraton ATL was in the first position on some dates and in the second position on other dates while Atlanta Hilton was in third position on all dates within the selected compset.
![]()
Click the Detail link to view the rate details for the all the proprieties that were available in the search result pages in a new window. The rate information is displayed based on the position of the properties. The rate rows of the properties that are there in the compset are highlighted in light blue.

Click the Shop button to activate a new real-time shopping of rates for a particular row of data. This is an easy way to spot shop for the latest rates. This real-time shopping usually takes less than a minute but may take more time during busy periods.
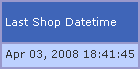
The Last Shop Datetime column displays the latest date and time when the rates on a particular row were shopped.
Click the Show Graph ![]() button to view a graphical representation of the rates.
button to view a graphical representation of the rates.